


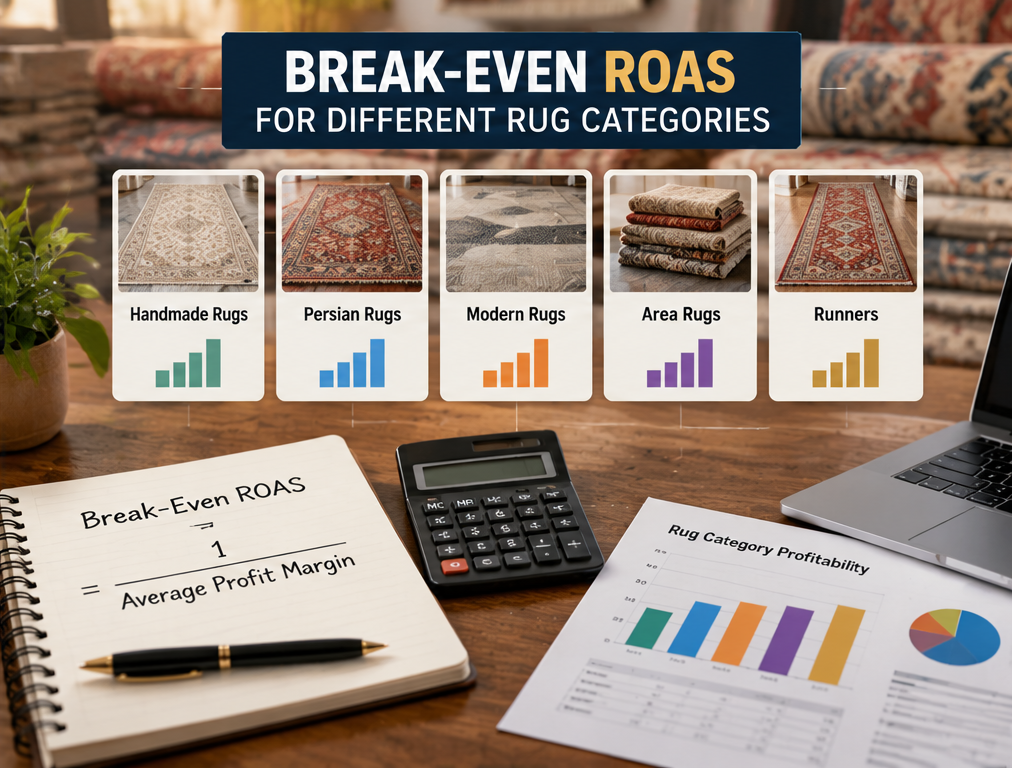
A rug store can report a strong return on ad spend and still lose money. The problem is that ROAS compares advertising-generated revenue with advertising cost, but it does not automatically account for the cost of the rug, payment processing, shipping subsidies, commissions, packaging, returns, or other variable expenses connected with fulfilling the order. A campaign generating $4 in sales for every $1 spent on advertising may be highly profitable for one rug category while barely breaking even for another category with a much smaller margin.
That is why a rug retailer should not use one universal ROAS target across every product category unless the economics are genuinely similar. Handmade rugs, antique pieces, machine-made rugs, clearance inventory, custom rugs, and lower-priced accessories can have very different cost structures. Calculating the rug break even ROAS for each major category gives the marketing team a more realistic benchmark for deciding whether advertising revenue is actually covering the costs associated with generating and fulfilling those sales.
Google Ads defines conversion value percost as total conversion value divided by advertising cost, which is effectively the platform’s value-to-cost measurement. Google also distinguishes advertising returns from broader business ROI because physical-product profitability depends on product costs and other business expenses.
Understand What Break-Even ROAS Means
Break-even ROAS is the point where the contribution generated from the advertised sales is enough to cover the advertising spend, leaving neither additional contribution profit nor an advertising loss under the costs included in the calculation.
The calculation starts with the category’s contribution margin percentage.
If a rug sells for $2,000 and the variable costs associated with selling that rug total $1,200, the business has $800 remaining before advertising and fixed overhead. That means the contribution margin is 40 percent.
If the company can spend at most $800 in advertising to acquire that $2,000 sale before exhausting the contribution margin, the break-even ROAS is:
$2,000 ÷ $800 = 2.5
The business therefore needs approximately 2.5x ROAS to break even on advertising under those assumptions.
Below 2.5x, the advertising cost consumes more than the available contribution margin. Above 2.5x, some contribution remains after the advertising expense.
The Basic Break-Even ROAS Formula
When you already know the contribution margin percentage, the calculation is straightforward:
Break-Even ROAS = 1 ÷ Contribution Margin
If contribution margin is 50 percent:
1 ÷ 0.50 = 2.0x
If contribution margin is 40 percent:
1 ÷ 0.40 = 2.5x
If contribution margin is 25 percent:
1 ÷ 0.25 = 4.0x
This immediately shows why one ROAS target cannot automatically be applied to every rug category. Higher-margin categories can tolerate more advertising cost relative to revenue, while lower-margin categories require a higher ROAS to avoid losing money.
Do Not Confuse Margin With Markup
This is one of the easiest ways to calculate break-even ROAS incorrectly.
Suppose a rug costs the retailer $1,000 and sells for $1,500. The markup on cost is 50 percent because the store added $500 to a $1,000 cost. However, the gross margin is only 33.3 percent because the $500 gross profit represents one-third of the $1,500 selling price.
Using 50 percent as the margin would produce a break-even ROAS of 2.0x.
Using the actual 33.3 percent gross margin produces approximately 3.0x.
That difference can completely change campaign decisions.
Always calculate margin using revenue as the denominator when using the break-even ROAS formula described here.
Start With the Real Landed Cost of the Rug
For imported or specialty rugs, purchase cost may not represent the complete inventory cost.
A rug could have a supplier cost plus freight, import expenses, customs-related costs, warehousing allocation, inspection, or other acquisition expenses the company treats as part of landed product cost.
The finance team should decide which costs belong in the category calculation and use the same accounting logic consistently.
If a Persian rug costs $1,800 from the supplier but another $300 of variable acquisition costs are required before it is ready to sell, using only $1,800 understates the cost and produces a break-even ROAS that looks more favorable than reality.
A reliable marketing ROI model begins with business numbers rather than advertising-platform numbers alone.
Add Payment Processing Costs
Credit-card and payment-provider fees reduce the contribution from an ecommerce sale.
If processing costs average 3 percent of revenue, a $4,000 order may lose approximately $120 to processing before advertising is considered.
For inexpensive products, this may feel relatively minor. Across substantial ecommerce volume, it can materially affect the category margin.
Use the actual average payment cost when possible rather than assuming one rate for every transaction. Financing providers, digital wallets, international cards, and other payment methods may have different economics.
The objective is not creating an accounting model down to every cent. It is avoiding a break-even calculation that ignores predictable variable costs.
Include Shipping When the Store Pays for It
Shipping is especially important for rug ecommerce because large rugs can be expensive to package and transport.
If the customer pays the full shipping cost separately and the business does not subsidize it, the impact may be limited. If the store advertises free shipping, however, shipping becomes a real variable expense connected to the sale.
Suppose a $2,500 rug has a $150 shipping cost paid by the retailer. That $150 reduces the amount available to pay for advertising.
Different rug sizes can also have very different fulfillment costs, so category-level break-even ROAS may need to reflect average shipping expense rather than relying exclusively on merchandise margin.
Include Sales Commissions When They Vary With Revenue
If salespeople receive a percentage commission on ecommerce, phone, or assisted purchases, that commission is another variable cost.
The same applies to marketplace commissions, affiliate fees, or other costs that occur only when the sale occurs.
Fixed salaries are different because they do not necessarily increase with each transaction. Whether fixed overhead belongs in the ROAS threshold depends on whether the business wants a media break-even target or a fully loaded profitability target.
Keeping those two calculations separate can make decision-making much clearer.
Understand Media Break-Even vs Fully Loaded Break-Even
A media break-even ROAS asks whether the gross contribution from the order covers the advertising spend after product and variable transaction costs.
A fully loaded break-even calculation may also allocate fixed costs such as payroll, rent, software, showroom overhead, warehousing, and other operating expenses.
Both can be useful, but they answer different questions.
The media break-even number is usually more practical for day-to-day advertising optimization because advertising decisions need to reflect the incremental economics of generating another sale.
The fully loaded number helps management understand whether the overall business remains profitable after all expenses.
Do not mix the two without explaining what is included.
Calculate Contribution Margin by Rug Category
Consider the following illustrative example, not an assumed industry margin:
| Category | Revenue | Variable Costs Before Ads | Contribution | Margin | Break-Even ROAS |
|---|---|---|---|---|---|
| Machine-made rugs | $100,000 | $72,000 | $28,000 | 28% | 3.57x |
| Handmade rugs | $100,000 | $55,000 | $45,000 | 45% | 2.22x |
| Antique rugs | $100,000 | $48,000 | $52,000 | 52% | 1.92x |
| Clearance rugs | $100,000 | $82,000 | $18,000 | 18% | 5.56x |
The numbers demonstrate why category economics matter. A campaign producing 3.0x ROAS would be above break-even for the illustrative handmade and antique categories but below break-even for the machine-made and clearance examples.
A marketing team looking only at campaign revenue could incorrectly conclude that every category is performing equally well.
Calculate Category Margin From Real Historical Data
Do not choose a margin based on what the category “should” earn.
Export actual historical orders and calculate revenue, product cost, transaction fees, shipping subsidy, sales commissions, and any other agreed variable costs by category.
Ideally, use enough data to smooth out unusual individual transactions.
A one-of-a-kind antique rug may produce an unusually high margin in one transaction, while another requires a large discount or expensive freight. Category-level averages can provide a more stable basis for advertising decisions.
For a business using Google Ads, the category structure used in advertising should be aligned closely enough with the financial structure that performance can be evaluated meaningfully.
Account for Discounts
A category’s list-price margin can look very different from its realized margin after discounts.
Suppose a handmade rug normally sells for $4,000 with $2,200 of variable cost before advertising. At full price, the contribution is $1,800, or 45 percent.
If a 20 percent promotion reduces the selling price to $3,200 while most costs remain unchanged, contribution falls to $1,000.
The margin is now approximately 31.25 percent, making break-even ROAS approximately 3.2x instead of 2.22x.
This illustrates why aggressive promotions can make a previously profitable advertising campaign unprofitable even if ROAS itself does not appear dramatically worse.
Returns Matter More for High-Ticket Products
Return rates should also be considered, particularly when the business absorbs outbound or return shipping costs.
Imagine two categories both have a 40 percent margin before returns. One has a very low return rate, while another frequently generates returns because online customers struggle with size or color expectations.
The second category has worse effective economics.
A practical model can include an average return allowance as a percentage of revenue or calculate profitability using net completed sales after returns.
For high-ticket rugs, even a small number of returns can materially change monthly profitability.
Use Average Order Value Carefully
ROAS is based on revenue, so higher average order values can make a campaign look attractive quickly.
However, a high order value is not automatically a high-profit order.
A $10,000 sale with $8,500 of variable cost contributes less profit than a $5,000 sale with $2,500 of variable cost.
This is why a rug marketing team should not optimize exclusively for top-line revenue when different inventory categories have substantially different margins.
Revenue is important, but contribution is what determines how much the business can afford to spend acquiring it.
Calculate a Target ROAS Above Break-Even
Break-even should normally be considered the floor, not the target.
If a category breaks even at 2.5x ROAS and the campaign consistently produces exactly 2.5x, the business is generating sales but leaving no contribution after advertising under the costs included in the model.
The desired target should therefore be higher than break-even.
For example, management might decide that a category with a 2.5x break-even ROAS should target 3.5x or 4.0x depending on growth goals, cash flow, fixed overhead, inventory strategy, and required profit.
There is no universal correct buffer.
A business aggressively acquiring new customers may accept a lower immediate return if repeat purchasing or designer relationships create meaningful lifetime value. A business selling mostly one-time high-ticket products may require stronger first-order profitability.
Do Not Set Target ROAS Without Enough Conversion Data
A financially correct target is useful only when the advertising campaign has enough data to optimize effectively.
If a rare antique rug category generates only one or two conversions per month, separating it into an extremely narrow campaign with its own automated ROAS target may create a data problem.
The financial model and advertising structure therefore need to work together.
You may calculate profitability at a detailed category level while keeping campaigns broader enough to generate useful conversion data.
The reporting can still segment performance later if product IDs, categories, and conversion values are implemented correctly.
Consider New vs Returning Customers
Break-even ROAS can also differ according to customer value.
If a first-time buyer frequently returns for additional rugs, cleaning, repair, accessories, or future design projects, the company may rationally accept a lower ROAS on the first purchase.
If most customers buy one major rug and rarely purchase again, the first-order economics become more important.
Do not automatically add speculative lifetime value to make an unprofitable campaign look successful.
Use actual customer data.
The distinction is particularly useful for a retailer building long-term designer and trade relationships because one initial acquisition may lead to several future projects.
Compare ROAS With Actual Profit
Google Ads can report conversion value divided by cost, but the advertising platform does not automatically know the full economics of every rug category. Google describes conversion value per cost as total conversion value divided by advertising cost, while broader ROI depends on the costs associated with generating the sale.
That means a campaign dashboard showing 4.2x ROAS is only the beginning of the analysis.
The business should ask:
What was the category margin?
Were the orders discounted?
How much shipping did the store absorb?
Were any orders refunded?
Were payment fees unusually high?
What was the actual contribution after ad spend?
These questions connect advertising performance with business performance.
Build a Simple Category Profitability Sheet
A basic spreadsheet can make the process manageable.
For each major category, track:
| Field | Example |
|---|---|
| Average selling price | $3,500 |
| Product/landed cost | $1,850 |
| Payment fees | $105 |
| Shipping subsidy | $145 |
| Other variable cost | $100 |
| Contribution before ads | $1,300 |
| Contribution margin | 37.14% |
| Break-even ROAS | 2.69x |
The calculation can then be updated monthly or quarterly as costs change.
If shipping rates rise, supplier pricing changes, or the business begins discounting a category more heavily, the break-even target should change too.
A static ROAS target created two years ago may no longer represent the business’s current economics.
Use Break-Even ROAS to Allocate Budget
Once category break-even points are known, the marketing team can make much better budget decisions.
Suppose one category is consistently producing 3.8x ROAS with a 2.0x break-even point, while another produces 3.8x with a 4.5x break-even point.
The advertising dashboard reports the same performance.
The financial outcome is completely different.
This is why a strong ROI strategy should combine campaign data with product economics rather than ranking campaigns only by top-line ROAS.
Budget can then be increased where profitable demand exists, reduced where categories are operating below break-even, or maintained temporarily when there is a strategic reason to accept lower immediate profitability.
Final Thoughts
Break-even ROAS gives a rug retailer a much more useful advertising benchmark than an arbitrary target such as “every campaign must achieve 4x.”
Different rug categories can support different acquisition costs because their margins, shipping expenses, discounts, fees, return rates, and other variable costs are different.
Start by calculating the true contribution margin for each meaningful category. Include landed product cost and the other variable expenses the business agrees should be part of the model. Then divide 1 by the contribution margin percentage to calculate break-even ROAS.
A category with a 50 percent contribution margin breaks even on advertising at approximately 2.0x ROAS. A 25 percent margin requires approximately 4.0x. A 20 percent margin requires approximately 5.0x.
Those numbers are not the final advertising targets. They are the point below which the business begins losing contribution under the assumptions used in the calculation.
Once the break-even level is known, management can set a higher target based on required profit, growth strategy, customer lifetime value, inventory position, and cash-flow goals.
That turns ROAS from a dashboard metric into a number connected directly to how the rug business actually makes money.
FAQs
What is break-even ROAS?
Break-even ROAS is the revenue-to-ad-spend level where the contribution generated by sales covers the advertising cost under the expenses included in the calculation.
How do I calculate break-even ROAS?
Divide 1 by the contribution margin expressed as a decimal. A 40 percent margin produces a break-even ROAS of 2.5x.
Why should different rug categories have different ROAS targets?
Categories can have different product costs, shipping expenses, payment fees, discounts, return rates, and margins, so the same advertising ROAS can produce different levels of profitability.
Is a campaign profitable when it reaches break-even ROAS?
It covers advertising under the costs included in the break-even calculation, but it does not necessarily produce additional contribution profit. Businesses usually need a target above the break-even level.
Should I use gross margin or contribution margin?
Contribution margin is generally more useful for advertising break-even analysis because it can account for variable costs beyond the product itself, such as payment fees, shipping subsidies, commissions, and other transaction-related expenses.